Visualization
ZADUVis renders pointwise scores with CheckViz and Reliability Map. Install the visualization extra to use Matplotlib:
Compute and render local scores
This example uses the arrays from the quickstart.
import matplotlib.pyplot as plt
from zadu import ZADU
from zaduvis import zaduvis

specs = [{"id": "tnc", "params": {"k": 25}}]
runner = ZADU(specs, original, return_local=True)
_, local_scores = runner.measure(projection)

local = local_scores[0]
trustworthiness = local["local_trustworthiness"]
continuity = local["local_continuity"]

fig, axes = plt.subplots(1, 2, figsize=(14, 6))
zaduvis.checkviz(
    projection,
    trustworthiness,
    continuity,
    ax=axes[0],
)
zaduvis.reliability_map(
    projection,
    trustworthiness,
    continuity,
    k=10,
    ax=axes[1],
)
plt.show()
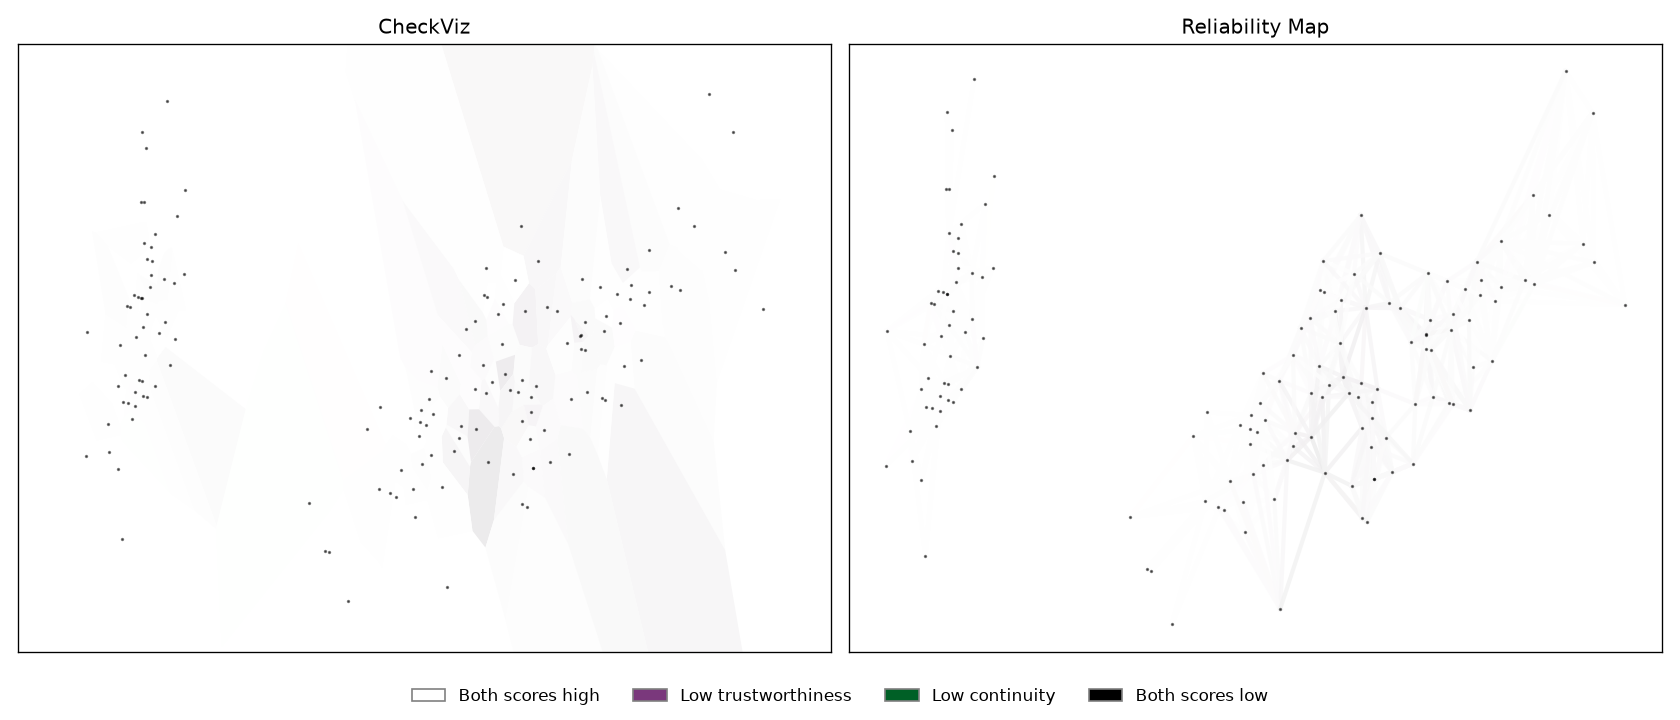
Both plots use the same local T&C values. Light regions indicate higher scores; color distinguishes false-neighbor and missing-neighbor contributions. CheckViz colors finite Voronoi cells, so boundary cells can remain unfilled. Reliability Map colors edges using the average scores of their endpoints.
The k=10 passed to reliability_map() sets the displayed neighbor graph. It
does not change the k=25 used to calculate T&C above. Supply local preservation
scores directly; do not invert them into error values. The projection must have
two columns; CheckViz requires geometry suitable for a Voronoi diagram.
CheckViz originates from Lespinats and Aupetit (2011). Reliability Map is described by Jeon et al. (2022).